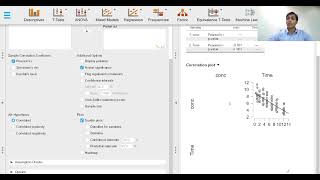
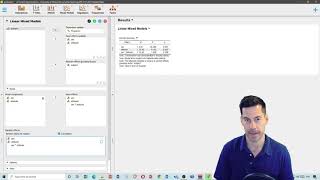
2. Linear mixed effects models - Input options

This video is intended to demonstrate how to use input options provided for linear mixed effects modeling in JASP and explain their functions.
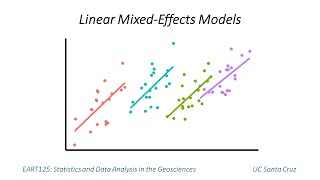
This video series is all about linear mixed effects models, what they are, when to use them, and how to perform them in JASP. The previous series on simple linear regression focused on building a regression model based on only one fixed effects variable variable. In mixed effects models, we use the fixed effects variable(s) of interest, and include a clustering or grouping random effects variable.
The analysis shown here is done in the statistical software package JASP
The JASP website: https://jaspstats.org/
The JASP download page: https://jaspstats.org/download/
The Campbell collaboration website for calculating effect sizes https://www.campbellcollaboration.org...
How to download and install JASP: • 1. How to download + install JASP t...
How to convert and upload a Microsoft Excel file to JASP: • 3. How to upload a data file to JASP
Types of data and variables: • 4. Types of data and variables how ...
Which statistical test to use: • 5. Which statistical test to use wh...
Null and alternative hypotheses: • 6. What are null and alternative hypo...
pvalue and statistical significance: • 7. The pvalue transcending beyond ...
Writing up the final report: • 8. Final reporting writing, copying...
Bayesian vs. Frequentist analysis: • Introduction to Bayesian analysis vs....
When should you use Bayesian analysis: • When should you use Bayesian analysis?
This tutorial shows how statistical analysis can be done free of cost, by anyone, irrespective of their mathematical aptitude. These tutorials are made especially for medical students and residents or any researcher in healthcare, who need data quickly analyzed, with tables, graphs, and plots conveying maximum information, and also reporting those results in a standard manner, so that writing the 'materials and methods' and 'results' section of the manuscript becomes a cakewalk.
Statistics, especially biostatistics, is an enigma all throughout undergraduate days for medical students. Applying a few formulae which didn't even make sense during a 15 minute biostatistics exam was all that was expected.
When it comes to research however, students often employ the services of a statistician to help analyze their data.
Seldom do students do statistical analyses on their own.
The following video series will help medical students to analyze their own data.
Our tool of choice is going to be JASP software, which is an excellent and free, opensource alternative to the goldstandard SPSS software, which needs users to pay to use the software a luxury students cannot afford!
The following series is going to focus on how to use the software to do statistical analyses, quite unlike what is taught in most medical schools. I hope that this series will help medical students to take up research early on in their undergraduate days, and also analyze their own data by themselves, completely independently. I also hope that this will change the perspective of biostatistics that medical students have, which is inculcated by the syllabus studied during their MBBS days.