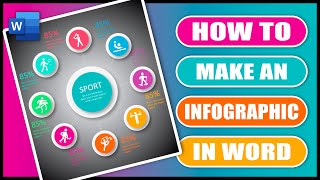
7 Common Types of Infographics

Editor's Note (October 23, 2019): You will find an updated version of this content here: • 10 Types of Infographics and When to ... (there are now 10 types of infographics!).
Learn more about the different types of infographics you can use ►https://www.easel.ly/blog/typesofin...
So you have your idea.
You’ve done your research.
And you’ve collected your data.
You're probably wondering what type of infographic design will best represent and communicate your information.
As you think about your infographic design, consider these 7 common types of infographics.
Number 1. The List infographic supports a claim through a series of steps. It is best used to support a specific claim or argument. Your list can go from top to bottom, left to right, or it can even move across your canvas!
Number 2. The Comparison or Vs. Infographic compares two things in a headtohead study. It is best used to highlight differences between two similar things or highlight similarities between two unlike things. It is also used to prove how one option is Superior or inferior to the other option.
Number 3. The flowchart infographic provides a specific answer to reader choices.
It is best used to provide personalized answers for readers or show how multiple situations can reach the same conclusion.
Number 4. A visual article infographic makes a piece of writing more visual. It is best used to cut down on text or make an article more interesting and enjoyable to consume. It also increases sharing potential through social media.
Number 5. The Map Infographic showcases data trends based on location. It is best used to compare places, culture, and people through setting centric data and demographics.
Number 6. The timeline infographic tells a story through chronological flow. It is best used to show how something has changed over time or make a long, complicated story easier to understand. It can also show how one thing leads to another.
Number 7. A Data visualization infographic communicates data through charts and graphs. It can even showcase data through design. It is best used to make datadriven arguments easier to understand and make facts or statistics more interesting to absorb.
These are just a few of the most common types of infographics, but it’s just enough to get you started on that next step of creating and designing your infographic!
Which type of infographic will best represent your information?
Tell us in the comments section below!
***************************************
#infographicdesign #infographics #infographictemplates
Subscribe ►https://www.youtube.com/Easellytutori...
***************************************
Get hundreds of editable infographic templates ► https://www.easel.ly/infographictemp...
Get help ► [email protected]
Get Easelly Pro for only $4/month ► https://www.easel.ly/proaccount?utm_s...'>https://www.easel.ly/proaccount?utm_s...
Get your custom infographic ► https://easel.ly/infographicdesign?ut...
Read our infographic design blog ►https://www.easel.ly/blog
***************************************
Homepage ► https://www.easel.ly/
Facebook ► / easellydesign
Twitter ► / easel_ly
Instagram ► / easel.ly
LinkedIn ► / easelly

![The 9 Types of Infographics [TIPS AND EXAMPLES]](https://i.ytimg.com/vi/tN8_85gKOTc/mqdefault.jpg)


![13 Types of Infographics and When to Use Them [+ Templates]](https://i.ytimg.com/vi/bZc-DjWd2BE/mqdefault.jpg)