15 YouTube views, likes subscribers in 10 minutes. Free!

A Level Biology Revision 'Pressure Changes during the Cardiac Cycle'

You can find all my A Level Biology videos fully indexed at https://www.freesciencelessons.co.uk/...
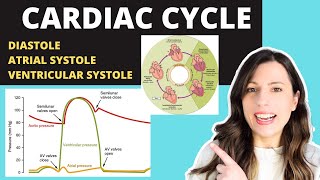
In this video, we look at the pressure changes taking place in the heart during the cardiac cycle. I show you how to interpret the graphs showing pressure changes in the left atrium, left ventricle and aorta. I also discuss how these pressure changes lead to valves opening and closing.
Image credits:
Wiggers diagram
https://commons.wikimedia.org/wiki/Fi...
DanielChangMD revised original work of DestinyQx, CC BYSA 2.5 https://creativecommons.org/licenses/..., via Wikimedia Commons


Recommended