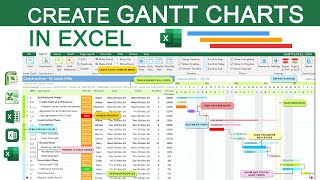
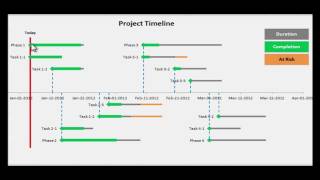
Actual Vs Planned Gantt Chart In One View - Project Management In Excel

We set up an actual vs expected Gantt chart in Excel. This will be useful for project planning purposes as it’ll show whether your project tasks are currently on track or not. A Gantt chart is a bar chart which is used to illustrate tasks to be completed over time in a project. To create our actual vs planned chart, we will add a series for the start planned dates and format this as a scatter chart.
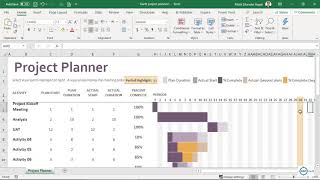
How To Create A Gantt Chart With A Progress Bar To Show Percentage Completion Of Tasks In Excel:
• How To Create A Gantt Chart With A Pr...
Subscribe for weekly Excel tutorials, techniques and examples:
/ @theexcelhub
Please share this video with others that may find it useful:
• Actual Vs Planned Gantt Chart In One ...
Please comment below if you have any feedback or any suggestions for videos you would like us to upload next!
The Excel Hub website: https://theexcelhub.com/
Instagram: / theexcelhub
ABOUT US:
The Excel Hub seeks to enhance your Excel and VBA knowledge by providing valueadding tutorials, techniques and examples in order to help you take your spreadsheet and data analysis skills to the next level.
For any enquiries, please contact:
[email protected]
Overview: (0:00)
Set Up Axis: (0:52)
Add Planned Bars: (1:41)
Formatting The Actuals: (5:02)
Potential Questions: (5:53)