A little secret to rock your YouTube subscribers

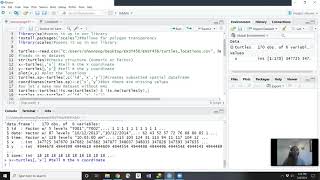
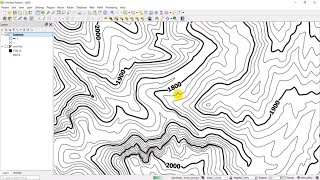
Add buffer count points nearest neighbor analysis and heat map in QGIS 3.10
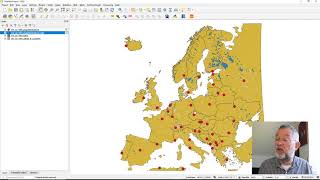
This video will demonstrate using QGIS 3.10 how to add a buffer around your points, how you can count the number of points within a given boundary, run basic statistics within an attribute table field, nearest neighbor analysis to determine if points are distributed randomly, evenly, or in a clumped fashion. We will also create a heat map to determine areas of high density of our points.


Recommended