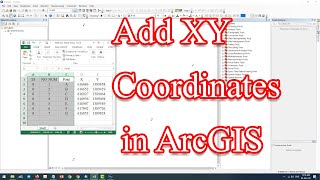
Add XY Coordinate Data to ArcGIS Pro from Excel

In this tutorial, you will learn how to import XY coordinate data into ArcGIS Pro from Excel, and how to plot them on a map.
The process of adding X Y coordinate data from an Excel sheet to a map using ArcGIS involves a simple yet powerful workflow. First, the Excel sheet needs to be properly formatted with separate columns for X and Y coordinates. In ArcGIS Pro, users can import the Excel sheet as a table or create a new shapefile or feature class. By using "Add Data" and then "X Y Point Data", users can link the X Y coordinate data to the spatial reference system of the map. Once the data is added, the points can be displayed on the map, and further symbology, labeling, and analysis can be applied.
The ability to add X Y coordinate data from an Excel sheet to a map in ArcGIS has numerous usages. It enables the visualization and analysis of point data, such as survey points, sampling locations, or GPS coordinates, in the context of a geographic space. This process allows users to overlay and integrate nonspatial data from Excel with existing spatial datasets, enhancing data exploration and decisionmaking. Users can perform spatial analysis, such as proximity analysis or spatial queries, to identify patterns or relationships within the data. Additionally, the added X Y coordinate data can be used to create maps for presentations, reports, or data sharing, providing a visual representation of the data and its spatial distribution. Overall, the process of adding X Y coordinate data from an Excel sheet to a map using ArcGIS greatly enhances data visualization, analysis, and communication of pointbased information.
Watch more tutorials on ArcGIS Pro, head to our special 'ArcGIS Pro Tutorials' playlist • ArcGIS Pro Tutorials