Automate Excel using Python + ChatGPT-4o 🤯

Explore All My Excel Solutions: https://pythonandvba.com/solutions
▀▀▀▀▀▀▀▀▀▀▀▀▀▀▀▀▀▀▀▀▀▀▀▀▀▀
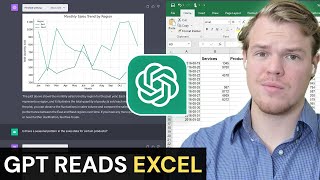
In this tutorial, I will show you how to use ChatGPT 4.0 to automate Excel tasks and create interactive charts. You'll learn to merge multiple workbooks and visualize data with PyEcharts, making your data processing more efficient. Perfect for anyone looking to enhance their Excel skills and streamline their workflow.
▀▀▀▀▀▀▀▀▀▀▀▀▀▀▀▀▀▀▀▀▀▀▀▀▀▀
【】Excel Addin (): https://pythonandvba.com/mytoolbelt
Dashboard Excel AddIn (): https://pythonandvba.com/grafly
Cartoon Charts Excel AddIn (): https://pythonandvba.com/cuteplots
Fun Emoji Excel AddIn (): https://pythonandvba.com/emojify
Excel Templates: https://pythonandvba.com/go/exceltem...
My Courses: https://pythonandvba.com/go/courses
Books, Tools, and More: https://pythonandvba.com/resources
▀▀▀▀▀▀▀▀▀▀▀▀▀▀▀▀▀▀▀▀▀▀▀▀▀▀
LinkedIn: / svenbosau
Instagram: / codingisfun_official
GitHub: https://github.com/SvenBo
Discord: https://pythonandvba.com/discord
Contact: https://pythonandvba.com/contact
☕ ?
If you want to support this channel, you can buy me a coffee here:
▶ https://pythonandvba.com/coffeedonation