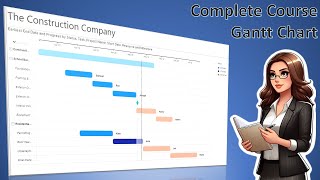
Building great Deneb Gantt visuals by almost cheating 😉

I'm looking at the Deneb visual, and asked my new best friend Vicky Vega (GPT AI) to assist. Find out what Deneb & AI can accomplish together!
Watch next Gantt chart visuals playlist
• GANTT charts in Power BI
Davide has a new version of his Gantt available: / davbacci_powerbivizualizationpowerbitips...
I created 2 GPTs, try them out here:
1: The PMO Pro, assists a project manager with anything PMrelated (based on PMI, Scaled Agile or OKR). https://bit.ly/The_PMO_Pro
2: Vicky Vega, assists Power BI report creators in building custom visuals using Vega or VegaLite (a JSON code that is used in the Deneb custom visual). https://bit.ly/VickyVega
*) Using GPT's requires a ChatGPT Plus subscription.
The TPC Newsletter (subscribe to get free content):
http://eepurl.com/dsm7dj
⌛ Learn about timeline visuals in Power BI:
• Timeline visuals in Power BI
In case you need a Gantt chart visual in reports:
• GANTT charts in Power BI
Calendar visuals inside Power BI:
• Calendars in Microsoft Project Part 1
Projectum Power PPM:
https://projectum.com/powerppm/
The Project Corner blog:
https://www.theprojectcornerblog.com
LET'S CONNECT:
Follow Me On LinkedIn / erikvanhurck
Follow Me On X / erikvanhurck
Chapters:
00:00 Introducing Deneb
01:30 Vega and VegaLite
02:35 Examples and a first try in the Vega Editor
03:50 Simple Gantt bar in VegaLite
05:05 using the Gantt example in Deneb
07:45 Expert example Gantt chart in Deneb
09:30 Introducing my GPT model: Vicky Vega
11:40 first result in Deneb
12:50 adding Percent complete in Deneb Gantt visual
16:10 end result