Calculate VHIVCITCISMIPDSISPI vegetation drought monitoring using Google Earth Engine (GEE).

In this video, we delve into the fascinating world of vegetation drought monitoring using Google Earth Engine (GEE). We explore the calculation of essential indices such as the Vegetation Health Index (VHI), Vegetation Condition Index (VCI), Temperature Condition Index (TCI), Soil Moisture Index (SMI), Palmer Drought Severity Index (PDSI), and Standardized Precipitation Index (SPI). Each of these indices plays a crucial role in assessing the health and resilience of vegetation in the face of drought conditions.
Firstly, we unravel the concept of the Vegetation Health Index (VHI), a comprehensive measure that combines both vegetation greenness (as captured by NDVI) and temperature data to provide insights into overall vegetation health. This index enables us to assess the vigor and vitality of vegetation over time, crucial for understanding its response to changing environmental conditions.
Next, we explore the Vegetation Condition Index (VCI) and Temperature Condition Index (TCI), which individually focus on the vegetative and thermal aspects of vegetation health, respectively. By examining these indices, we gain a deeper understanding of how vegetation responds to variations in temperature and moisture levels, providing valuable insights into its condition.
Moving forward, we delve into the Soil Moisture Index (SMI), a key indicator of soil moisture content derived from satellite data. Understanding soil moisture is essential for evaluating the availability of water to support plant growth and development. By analyzing SMI, we can assess the moisture status of the soil, crucial for predicting drought conditions and their impact on vegetation.
We then explore the Palmer Drought Severity Index (PDSI), a widely used measure for assessing drought severity based on precipitation, temperature, and soil moisture data. PDSI offers valuable insights into the intensity and duration of drought conditions, enabling us to gauge the potential impact on vegetation health and productivity.
Finally, we delve into the Standardized Precipitation Index (SPI), which focuses solely on precipitation data to assess drought severity and duration. By standardizing precipitation anomalies over different time scales, SPI provides a robust measure for monitoring drought conditions and their implications for vegetation.
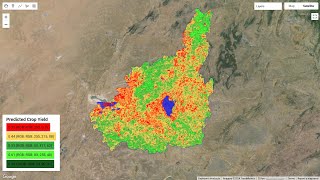
Through the integration of these indices, we construct a comprehensive Hazard Index that encapsulates the combined impact of various environmental factors on vegetation health. This Hazard Index serves as a valuable tool for identifying areas at heightened risk of vegetation stress and droughtinduced damage, crucial for effective drought monitoring and mitigation efforts.
Overall, this video provides a detailed exploration of the methodologies and insights gleaned from the calculation of various indices for vegetation drought monitoring using Google Earth Engine.
Vegetation Health Index (VHI): A composite index that combines information from both the Normalized Difference Vegetation Index (NDVI) and Land Surface Temperature (LST) to provide insights into vegetation health and stress.
Vegetation Condition Index (VCI): An indicator of the greenness and overall condition of vegetation, derived from NDVI data, which helps us understand the current state of vegetation health.
Temperature Condition Index (TCI): Reflects temperature anomalies that may impact vegetation health, providing crucial information about thermal stress and its effects on vegetation.
Soil Moisture Index (SMI): This index assesses soil moisture levels, a critical factor influencing plant growth and agricultural productivity. By monitoring SMI, we gain insights into soil moisture conditions and potential drought stress.
Palmer Drought Severity Index (PDSI): A widely used drought index that integrates both precipitation and temperature data over a specified period to quantify drought severity and duration.
Standardized Precipitation Index (SPI): SPI measures precipitation deviations from the longterm average, helping identify dry or wet spells and assess drought severity based solely on precipitation data.