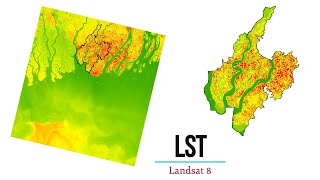
Calculating Chlorophyll Index u0026 Global Environmental Monitoring Index from Landsat 8 -

#Exploretutorials #ArcGIS #Chlorophyll_Index_Global Environmental_Monitoring_Index
==================================================
GIS Work|| Best laptop at Low cost!!
Acer Predator Helios: https://amzn.to/3MzpjWM
ASUS TUF Gaming: https://amzn.to/3CwUpti
Lenovo Legion: https://amzn.to/3g87HEW
MSI Stealth: https://amzn.to/3CX9qWH
MSI GV15: https://amzn.to/3EHtSfM
Acer Nitro: https://amzn.to/3CBJLSh
==================================================
The Chlorophyll Index
Green (CIg) is a vegetation index for
estimating the chlorophyll content in leaves using the ratio of reflectivity in
the nearinfrared (NIR) and green bands.
CIg = [(NIR / Green)1]
NIR = pixel values from the nearinfrared band
Green = pixel values from the green band
Using a spacedelimited list,
you will identify the NIR and green bands in the following order: NIR Green. For example, 7 3.
Reference:
Gitelson, A.A., Kaufman, Y.J., Merzlyak, M.N., 1996. "Use of a green channel in
remote sensing of global vegetation from EOSMODIS," Remote Sensing of Environment,
Vol. 58, 289–298.
************************************************
Best Books on ArcGIS Learning
♥♥♥ArcGIS DESKTOP: https://amzn.to/3fWhU4p
♥♥♥ArcGIS Pro 2.6: https://amzn.to/3xFEZ1l
♥♥♥Ebook Reader: https://amzn.to/3CGtxXe
************************************************
Best GIS Learning Site for Beginner
:Mapping Spatial Analysis: https://cutt.ly/tQCxMtM
:GIS Specialization: https://cutt.ly/pQCzVfl
: GIS Data Acquisition and Map Design: https://cutt.ly/nQCkgaA
: GIS Data Formats, Design & Quality: https://cutt.ly/pQClOUO
: Survey Data Collection and Analytics: https://cutt.ly/4QClKpl
************************************************
My Laptop Series: https://amzn.to/3m1ie5L
************************************************
For more information: https://www.indexdatabase.de/db/isin...
GEMI method
The Global Environmental Monitoring Index (GEMI) is a nonlinear vegetation index for global environmental monitoring from satellite imagery. It's similar to NDVI, but it's less sensitive to atmospheric effects. It is affected by bare soil; therefore, it's not recommended for use in areas of sparse or moderately dense vegetation.
GEMI = eta*(10.25*eta)((Red0.125)/(1Red))
where,
eta = (2*(NIR^2Red^2)+1.5*NIR+0.5*Red)/(NIR+Red+0.5)
NIR = pixel values from the near infrared band
Red = pixel values from the red band
Using a spacedelimited list, you will identify the NIR and red bands in the following order: NIR Red. For example, 4 3.
This index outputs values between 0 and 1.
Reference: Pinty, B. and Verstraete, M. M. 1992, "GEMI: a nonlinear index to monitor global vegetation from satellites," Plant Ecology, Vol. 101, 15–20.
Important Tutorials:
ArcGIS Geodatabase Design Basic File Geodatabase, Field, Subtype, Domain: https://cutt.ly/JYSmgQa
Free Spatial Data |Shapefile| of Any Country & Humanitarian Data: https://cutt.ly/1WawYD1
Land Cover Data 10 m Resolution: https://cutt.ly/3Waqcvo
Least Cost Path: https://cutt.ly/xWaqmEb
Download Open street Map: https://cutt.ly/SWaqWFk
Stream Power Index SPI Calculation:https://cutt.ly/jWaqT9t
Topographic Wetness Index TWI Calculation: https://cutt.ly/qWaqIw5
Suitability Analysis Using Arcgis: https://cutt.ly/6WaqSnA
Add xy data from excel, clip, select, split, table select tools in ArcGIS: https://cutt.ly/mWaqGuS
Drainage or Stream Frequency & Infiltration number: https://cutt.ly/7WaqJ5U
Calculate Stream or Drainage Density: https://cutt.ly/VWaqX36
Extracting Stream or Drainage Network from DEM: https://cutt.ly/QWaqMS9
Detail Watershed Delineation using DEM: https://cutt.ly/TWaq3Lk
ArcGIS Tutorial:https://cutt.ly/qWaq7gu
Qgis Tutorial: https://cutt.ly/ZWaq6e2
Change Detection: https://cutt.ly/sWawwfX
Download Free Shapefile:https://cutt.ly/XWawrsG
Download Soil Organic Carbon, Evapotranspiration, Land cover, Precipitation Data: https://cutt.ly/cWawtFC
Human Influence Calculation: https://cutt.ly/TWawuPv
Lineaments Extraction :https://cutt.ly/sWawi3K
World Soil Map Shapefile: https://cutt.ly/tWawaxY
Hotspot / Kernel Density Analysis: https://cutt.ly/nWawgLt
GIS Shapefile Data ( Road, Structure, etc.) for Any Country: https://cutt.ly/WWawjPq
Land Cover Change Detection: https://cutt.ly/cWawleE
Soil Moisture Index and Land Surface Temperature Calculation: https://cutt.ly/tWawzhs
Calculate normalized burn ratio (NBR): https://cutt.ly/WWawxL9
Tags: green chlorophyll index formula, leaf chlorophyll index formula, chlorophyll index green
savi index formula sentinel2, rededge chlorophyll index, chlorophyll index remote sensing, normalized difference chlorophyll index, gis application, esri maps, gis technology,normalized difference red edge index,gis, analyse, online education, analysing, arcgis desktop,