Calculating Stream Power Index (SPI) in ArcGIS | DEM

In this video tutorial you will learn how to calculate Stream Power Index (SPI) using ArcGIS.
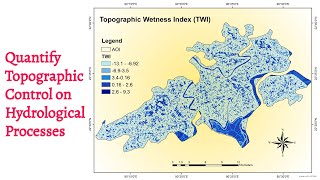
What is Stream Power Index (SPI)?
The Stream Power Index (SPI) is a measure of the erosive power of flowing water. SPI is calculated based upon slope and contributing area.
SPI is a measure of the erosive power of flowing water calculated as:
SPIi = ln(DAi * tan(Gi))
where SPI is the stream power index at gridcell i, DA is the upstream drainage area (flow accumulation at gridcell i multiplied by gridcell area), and G is the slope at a grid cell i in radians.
SPI Negative values = Deposition
SPI Positive values = Erosion
Join this channel to get access to perks:
/ @gismadras
How to Download 30m SRTM DEM Data from Earth Explorer / USGS Free
• How to Download 30m SRTM DEM Data fro...
Steps for Stream Power Index (SPI) using ArcGIS
Step 1: Download DEM or DTM Data
SRTM 1 ArcSecond Global – 30m (Used for this Study), USGS Website https://earthexplorer.usgs.gov/
Step 2: Project Raster
From Geographic Coordinate System (GCS) to Projected Coordinate System (PCS)
Using Project Raster Tool
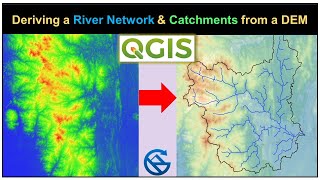
Step 3: Flow Direction
Step 4: Flow Accumulation
Step 5: Slope in %
Step 6: Stream Power Index (SPI)
Ln(“Flow_Accumulation"+0.001)*((Slope%/100)+0.001)
Chapter
00:00 Introduction
01:22 Project Raster
03:44 Fill
04:45 Flow Direction
05:36 Flow Accumulation
07:32 Slope in %
08:22 Stream Power Index (SPI)
10:05 Changing Symbology for SPI
11:55 Clip
#StreamPowerIndex #ArcGIS #SPI #flowdirection #flowaccumulation #slope #streampoweeindex #erosion #deposion #clipraster