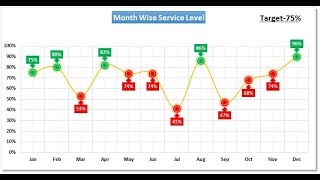
Conditional Chart Formatting (Line Chart)

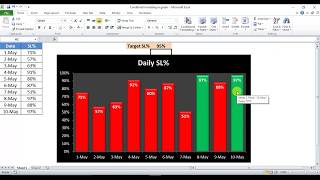
In this video, I demonstrate how to create a chart with dynamic formatting. This means the chart data points will change formatting based on some defined conditions or parameters.
The example in this video is a line chart, that will format the data points red or green based on if the data points is above or below a certain limit.
Check out my channel for more videos and tutorials for engineers!
Like, follow, share and don't be afraid to drop me a comment/message with feedback, questions, or video suggestions!
Thanks for watching!
Channel Link: / @theengineeringtoolboxchannel
Other great content!
Excel For Engineers: Other
• Top 17 Excel Tips, Tricks, & Producti...
Excel Tips and Tools Every Engineer Should Know:
• Histograms (in Excel '16) Excel Tip...
Follow and interact!
Twitter: / theengtoolbox
Facebook: / theengineeringtoolbox
#EngineeringToolbox
#ExcelTipsandTricks
#ExcelTutorials
#MicrosoftExcel