Continuous Probability Density function of X is given by k/x^2 Expectation Variance Quartiles

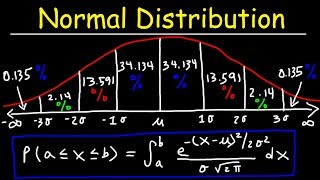
Uniform Continuous Distribution: • Uniform Continuous Distribution Funct...
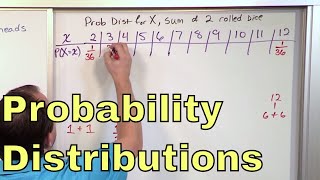
Related Example: • Stem and Leaf Plot with Calculation o...
#LeafPlot #stemandleafplot #anilkumar #globalmathinstitute #statistics_gcse #datamanagement_ibsl
Quartile Interquartile range, semiquartile range, outliers and data analysis from the boxandwhisker plots: • How to Find Quartiles and InterQuart...
/ @mathematicstutor
Learn from Anil Kumar: [email protected]
Stemandleaf plot is an excellent method to organize the data as it is being collected. Data element is divided in two parts where the unit place value comes in the leaf and the rest is organized in the corresponding stem. It looks like a horizontal bar graph with all the values from where it is very easy to analyze the data.
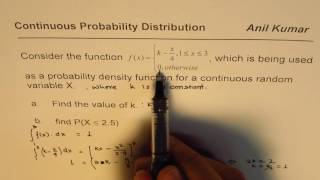
A continuous random variable X takes values in the interval [1, 3]. The probability density function of X is given by k/x^2 .
a. Determine the value of k
b. Find E(X) and Var(X)
c. Calculate P(X 5/3)
d. Calculate the lower and upper quartiles of X


![[Chapter 6] #4 Joint distribution of two continuous random variables](https://i.ytimg.com/vi/Ty64JsNlcnk/mqdefault.jpg)