Covid-19 Map: Complete Tutorial using react leaflet hooks and bootstrap - Choropleth map

I’m excited to be sharing this tutorial with you. We will be creating a Covid19 Choropleth map using React Leaflet, React Hooks, GeoJson, Papa Parse, Bootstrap and flexbox. I will take you through every step of creating this application.
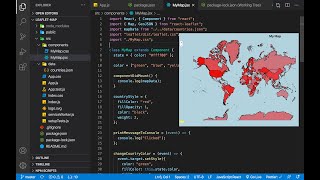
This Covid19 map will display confirmed cases from around the world. Countries with the most cases are shown in dark red and those with fewer cases have a lighter color. This map is interactive and lets you click on each country for more details.
We will even be creating a nice legend to place at the bottom of the map.If you're wondering what this type of map is called it’s called a choropleth map. It uses different shading and color to display some statistic in this case we are using covid19 confirmed cases
If you enjoy my videos please subscribe, like and share.
Links
Github Project:
https://github.com/CodingWithAdam/co...
Demo working solution
https://codingwithadam.github.io/cov...
Bootstrap
https://getbootstrap.com/
Leaflet
https://leafletjs.com/
React Leaflet
https://reactleaflet.js.org/
GeoJson file datahub web page
https://datahub.io/core/geocountries
GeoJson direct link to file
https://datahub.io/core/geocountries...
ISOA3 country codes
https://en.wikipedia.org/wiki/ISO_31661
Wikipedia GeoJSON
https://en.wikipedia.org/wiki/GeoJSON
formatNumberWithCommas = function (number) {
return number.toString().replace(/\B(?=(\d{3})+(?!\d))/g, ",");
};