Grow your YouTube channel like a PRO with a free tool

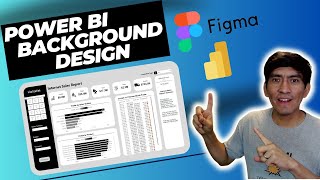
Create a 'Glass Effect' Design with Figma for Power BI

Sometimes you just need to do something a little fun and crazy in Power BI, am I right? Here's how to add fancy effects to your report/dashboard design using the freetier Figma account.
0:00 Intro
1:38 Create the frame
2:27 Add shapes
5:00 Add "cards" & blur layer effect
11:39 Icons
13:38 Export
14:47 Import


Recommended