Create Dashboard with Folium Map Streamlit and Python - Full Course

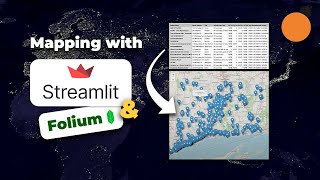
In this tutorial I will show you how to develop an interactive Folium map dashboard with Python and Streamlit. The dashboard visualizes data in an interactive folium map. The dashboard demonstrates Fraud and Identity Theft Report published by Federal Trade Commission.
Live Demo: https://share.streamlit.io/zakariacho...
Code: https://github.com/zakariachowdhury/s...
Fraud Report Data: https://github.com/zakariachowdhury/s...
US State Boundaries: https://public.opendatasoft.com/explo...
Source Dashboard: https://public.tableau.com/app/profil...
Public Dataset List: https://github.com/awesomedata/awesom...
:
00:00 | Dashboard Overview
01:40 | Create Dashboard Skeleton
06:23 | Display Fraud Reports
16:23 | Refactor Fraud Facts Code
18:15 | Display Total Loss
22:43 | Display Median Loss
27:17 | Display Fraud Facts Columns
29:29 | Display Folium Map
37:37 | Plot Overlay on The Map
44:28 | Add Tooltip on The Map
57:02 | Filter Data on Click Map
1:00:07 | Add Time Filters
1:04:28 | Add State Filter
1:11:16 | Add Report Type Filter
1:13:13 | Conclusion