Create Verra's JNR Deforestation Risk Map in Google Earth Engine

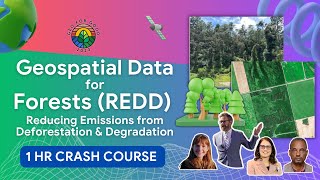
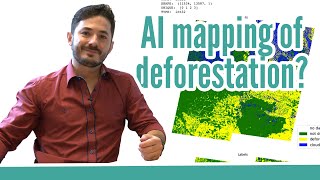
Verra's Jurisdictional & Nested REDD+ (JNR) has a method to create a deforestation risk map using multitemporal deforestation data, current forest, and deforestation rate. It uses the convolved or moving windows approaches. In the end, it will be reclassified into 30 deforestation risk classes where class 30 has the highest risk.
Read more here: https://verra.org/wpcontent/uploads/...
Check the script here: https://code.earthengine.google.com/5...
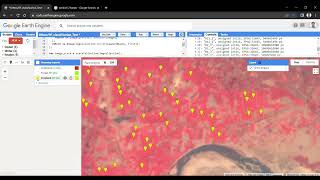
In this video and script, I will show you how to use the method on Google Earth Engine where we could create all the data necessary in a single script instantly. I am my previous deforestation mapping videos where I composite the Landsat Imagery, calculate vegetation index, and mask the forest value.
In this video I am using three periods of forest in 1990, 2005, and 2020 where I will get deforestation in 1990 2005, 2005 2020, and the current forest in 2020. I am using Palangkaraya City, Central Kalimantan as an example. I also present the legend for easy interpretation.
I hope my video could help your project and research
Email: [email protected]
Linkedin: / ramiqcom
GitHub: https://github.com/ramiqcom