15 YouTube views, likes subscribers in 10 minutes. Free!

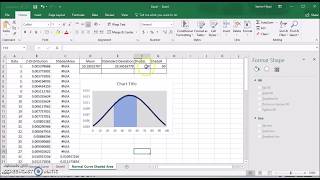
Creating a Graph of the Standard Normal Distribution in Excel

This video demonstrates how to create a graph of the standard normal distribution using Microsoft Excel. The standard normal distribution has a mean of zero and a standard deviation of one. The graph dynamically displays the area under the curve from the left of the distribution for a specified zscore.


Recommended