A little secret to rock your YouTube subscribers

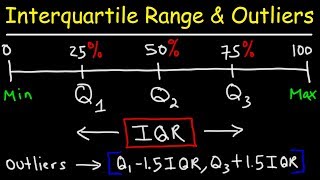
Cumulative Frequency Diagram Median Lower u0026 Upper Quartile Interquartile Range Percentile

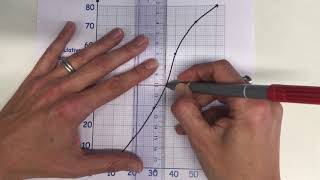
We learn how to draw and use a cumulative frequency diagram to find the median, lower and upper quartiles, the interquartile range, 90th percentile and how to use the diagram to draw a box plot.
******* TIME STAMPS / CHAPTERS *******
00:00 Introduction
00:50 Cumulative Frequency Column
02:13 Plotting Points & Curve for Cumulative Frequency Diagram
04:33 Median Value
05:55 Lower & Upper Quartile
07:37 Interquartile Range
08:02 Median at n/2 or (n+1)/2 ?
09:03 Box Plot
10:22 90th Percentile (How to Find it)
11:54 Percentage Measuring Less than 32cm

![Understand Frequency Tables, Cumulative & Relative Frequency in Statistics [773]](https://i.ytimg.com/vi/Md2_E_hTvdQ/mqdefault.jpg)


Recommended