Data and Design: Making stories visible

From your iPhone stats to the Covid19 briefing slides, data visualizations are increasingly present in our lives.
How can designers bring numbers and stories to life and give meaning that is understandable?
In this collaborative event with global think tank ODI, join our expert panel to explore design and data. Discover how information design and data visualization has been used to communicate complex stories, uncover truths and challenge myths in times of crisis.
Our expert panel will be chaired by Marta Foresti and includes curator Natalie Kane, designer Leonardo de Vasconcelos, data visualsation journalist John BurnMurdoch and information designer Federica Fragapane.
Speakers:
Marta Foresti is the Director of ODI Europe and of ODI’s Human Mobility Initiative. She coleads Keyworkers and the Mayors Dialogue on Growth and Solidarity with Federica Fragapane and she has a keen interest in research and design, most recently discussed at this masterclass at Palazzo Grassi. https://www.odi.org
Natalie D Kane is a curator, writer and researcher based in London, UK. She is Curator of Digital Design at the V&A, South Kensington. https://ndkane.com/
Leonardo de Vasconcelos is a Brazilian designer based in London. His recent project Judging by the Cover uses data visualisation to highlight inequity in design publishing. Sparked by the lack of Black representation, the project shows the gap between white and BIPOC professionals in design books. http://leovasconcelos.com/
John BurnMurdoch is the Financial Times’ senior data visualisation journalist, and creator of the FT’s coronavirus trajectory tracker charts. He has been leading the FT’s datadriven coverage of the pandemic, exploring its impacts on health, the economy and wider society. When pandemics are not happening, he also uses data and graphics to tell stories on topics including politics, economics, climate change and sport, and is a visiting lecturer at the London School of Economics. / jburnmurdoch
Federica Fragapane is an awardwinning freelance information designer and ODI Research Associate who has worked with ODI, Google, BBC Science, National Geographic Kids and many others. Federica is a coauthor of Planet Earth: Infographics for Discovering Our World and her work has been featured as design of the week by Design Emergency and by design magazine Wallpaper. https://www.behance.net/FedericaFraga...
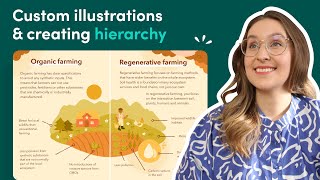
Key workers – Draft, courtesy of Federica Fragapane.
Key workers. Migrants’ contribution to the COVID19 response. Designed by Federica Fragapane and Alex Piacentini for the Overseas Development Institute (ODI). https://migrantskeyworkerscovid19....
Alan Smith / Financial Times
John BurnMurdoch / Financial Times
Visualisation of UCA Canterbury Reading List, 2020, Designed by Leonardo de Vasconcelos. Original reading list: Welcome Guide, 2018, Canterbury University for the Creative Arts.
Judging by the Cover, 2020. Designed by Leonardo de Vasconcelos. http://judgingbythecover.com/
Decolonizing Reading Lists, AEM Toolbox, University of the Arts London.
First U.S. Census, 1790. Image Courtesy of US Census Bureau.
“Proportion of Freemen and Slaves among American Negroes”, 1900 W.E.B. Dubois chart showing national overview of the total number of free AfricanAmericans in the United States from near the beginning of slavery to five years after the U.S. Civil War.
Exposition des Nègres d’Amerique ("Exhibit of the American Negroes"), Exposition Universelle, Paris 1900. Special Collections and University Archives, University of Massachusetts Amherst Libraries.
Wednesday 31 March 2021