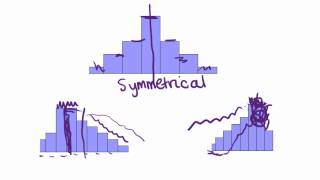
Describing Histograms

A look at how to describe histograms based on CENTER, SPREAD, SHAPE and OUTLIERS. Some important keynotes:
When the data is skewed right, the mean will be larger than the median.
When the data is skewed left, the mean will be smaller than the median.
When the data is symmetrical, the mean and median will be about the same.
For bimodal data, you probably want to look at two separate sets of data rather than the one you're currently looking at. Adjusting the class width may make it easier for you to see which measure of central tendency to use.
The only measure of spread we've talked about so far in class is range. This is found by taking the maximum and subtracting the minimum. It helps give us an idea of how spread out the data is.
Thanks Eric, for the correction at 3:15