Rock YouTube channel with real views, likes and subscribers

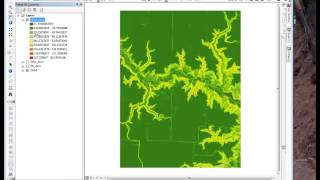
Displaying DEMs to Show Hydrologic Features: Part 1

Exercise 1 of the Hydrologic Applications module. Learn how to display LiDAR data in ArcGIS a way that highlights hydrologic features.
This is part of the "Conservation Applications of LiDAR Data" series. Additional lectures, exercises and other training materials are at z.umn.edu/lidar.
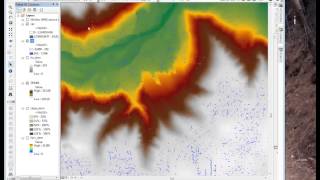
Time points: 1:46 Setup ArcGIS; 2:32 environmental settings; 6:32 TPI software and the Land Facet Analysis Tool Bar. 7:55 create a hillshade layer; 10:05 display properties of the hillshade; 12:55 loading an aerial image; 15:55 "fire" display to highlight hydrologic features.


Recommended