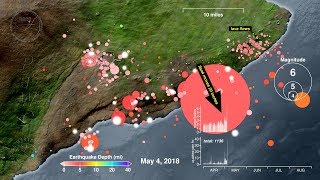
Earthquake Animation: Kīlauea Caldera - 1 April to 31 August 2018

The NWS’s Pacific Tsunami Warning Center (PTWC) mitigates tsunami hazards in Hawai‘i produced by large, distant earthquakes throughout the Pacific Ocean, but PTWC also issues warnings for tsunamis generated by earthquakes within the State of Hawai‘i itself. The last such dangerous tsunami was generated by a 7.7 magnitude earthquake on the Big Island of Hawai‘i in 1975. Small earthquakes generated by volcanic activity are far more common, and typically have a magnitude less than 3.0 and occur a few times a day. That rate changed on the afternoon of April 30, 2018, when an earthquake “swarm” began within Kīlauea Volcano such that earthquakes began to occur far more frequently, about 100 per day.
This animation is shows the earthquake activity and topographic changes of Kīlauea's summit area, Kīlauea Caldera, by transitioning the map to include recent highresolution LIDAR data in the underlying topographic relief image. It begins a month earlier on April 1 to start with a more typical earthquake pattern and proceeds forward in time at a rate of one day per second. White circles indicate the location of earthquakes as they occur with their sizes proportional to their magnitudes. Lava began to erupt from Kīlauea’s Lower East Rift Zone on May 3 (see the “first 100 days” link below) and the level of the lava lake within Halema‘uma‘u Crater began to drop the next day. By May 15 the lava lake had dropped hundreds of feet below the crater floor before producing steamdriven explosions when the molten rock interacted with ground water. Some of these explosions were strong enough to register as earthquakes with magnitudes greater than 5.0 and send ash clouds to 30,000 ft. above sea level. By the end of May, however, these explosions changed their character such that they no longer produced large steamdriven ash clouds. The walls of Halema‘uma‘u had begun to collapse, thus widening it and deepening it as magma continued to drain from the summit to feed the flank eruption. These “collapse explosions” seemed to release trapped volcanic gas rather than groundwater steam and yielded only small ash clouds, though they still released explosive energy greater than magnitude 5.0 earthquakes and occurred about once per day (see the “collapse explosion” link below for a full description). No explosions have occurred since August 2 (as of Sept 22, 2018).
This animation includes charts showing some statistics about the earthquake activity. The top graph shows the earthquake magnitudes as they occur. The bottom graph shows the number of earthquakes per hour within the map area. With the subsidence of Kīlauea Caldera and the collapse of Halema‘uma‘u the number of earthquakes dramatically increased to more than 40 per hour by June 15 and continued until August 4 when they suddenly returned to normal background levels, coinciding with the pause in the eruption of lava from the Lower East Rift Zone in Puna.
Though PTWC monitors all earthquakes in Hawai‘i, including this volcanic activity, the primary responsibility for mitigating volcanic hazards in the State of Hawai‘i rests with the USGS’s Hawaiian Volcano Observatory who publishes updates daily and advises local emergency managers.
An animation of activity associated with the 2018 Kīlauea eruptions, including lava flows:
• Kīlauea Volcano’s Earthquakes and Eru...
Explanation of “collapse explosions” within the caldera:
https://volcanoes.usgs.gov/observator...
Video of "collapse explosion" earthquake:
https://volcanoes.usgs.gov/vsc/movies...
The Hawaiian Volcano Observatory's eruption information page:
https://volcanoes.usgs.gov/observator...
For general information about explosive eruptions in Hawai‘i:
https://pubs.usgs.gov/fs/fs13298/
For general information about earthquake hazards in Hawai‘i:
https://volcanoes.usgs.gov/observator...
Origin of earthquakes in the Hawaiian Islands:
• Hawai`i—Origin of Earthquakes & What ...
Comparison of historic earthquakes in Hawai‘i by magnitude:
• Context: a graphical comparison of ea...
1975 Hawai‘i Island tsunami:
• Tsunami Animation: Hawaii 1975
Earthquake data source:
https://earthquake.usgs.gov/earthquak...
LIDAR data source:
https://opentopography.org/news/2018...