Earthquakes of Cascadia: 1979 - 2019

The widelyfelt M6.3 earthquake of August 29, 2019 on the Blanco Fracture Zone was only the most recent of many moderatesize earthquakes to strike this region off of the Oregon coast. As this animation shows, such earthquakes are common along the boundaries of the Juan de Fuca plate with the Pacific Plate, which also includes the Juan de Fuca Ridge, the Gorda Ridge, and the Mendocino Fracture Zone. Fortunately these events rarely pose a tsunami hazard since the largest of these earthquakes tend to have strikeslip mechanisms that move the seafloor mostly sideways with little disruption to the ocean above.
The Juan de Fuca Plate meets the North American Plate, however, with a very different sort of plate boundary: a subduction zone. This plate boundary can produce megathrust earthquakes with large vertical motions that cause devastating tsunamis. It has been more than 300 years since the last time the Cascadia Subduction Zone generated such destruction, on January 26, 1700. This subduction zone also created the volcanoes of the High Cascades, stretching from northern California into southern British Columbia.
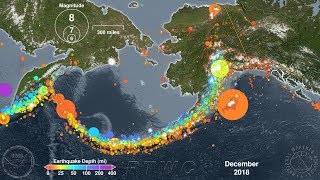
To put the recent earthquake in context this animation begins 40 years earlier, in 1979. In that time frame 10 earthquake of M6.0 or larger occurred on the Blanco FZ and more than a dozen along the Mendocino FZ, some with M7.0 or larger. The fracture zones off of Vancouver Island have also produced numerous earthquakes larger than M6.0, with one as large at M6.8. The largest earthquake on the Cascadia Subduction Zone in the last 40 years was the M6.8 Nisqually Earthquake in southern Puget Sound on February 28, 2001. The volcanic activity of Mt. St. Helens is also visible in 19801982 and 20042008. As the area covered by the animation extends over North America, it also includes activity unrelated to Cascadia, such as the October 28, 1983, M6.9 southern Idaho earthquake and numerous small events associated with the Yellowstone Caldera.
Please note that this animation shows every earthquake in the USGS/NEIC catalog for this region. As the animation moves forward in time so too does the science of seismology with the continual addition of newer and better instruments. As the animation approaches the present day these instrument networks are able to detect smaller and smaller earthquakes, creating the illusion of increasing activity. In reality these smaller earthquakes have always been there, but the technology has only recently been able to detect them.
Earthquake Data Source: United States Geological Survey (USGS)/National Earthquake Information Center (NEIC) searchable catalog:
https://earthquake.usgs.gov/earthquak...