Estimating Methane (CH4) concentration for any study area | Google Earth Engine | TSC Analysis
In this video tutorial you will learn how to access, analysis and estimate Methane (CH4) concentration using Google Earth Engine. I had also shown how to prepare Time Series Chart for methane concentration at different time or month.
Join this channel to get access to perks:
/ @terraspatial
Free access of Codes for the above video:
https://code.earthengine.google.com/4...
Topics Covered in the Video
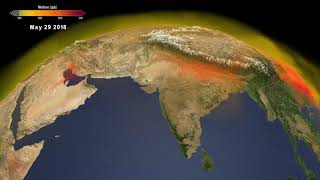
1. Data Collection: First, you need to acquire the necessary satellite data that contains methane concentration measurements. Google Earth Engine provides access to various remote sensing datasets, including those related to greenhouse gas concentrations. The specific dataset you'll use will depend on the satellite sensor and methane measurement source.
2. Study Area Selection: Define the study area for which you want to estimate methane concentration. This can be done using the geographical coordinates or by drawing a region of interest (ROI) on the map in Google Earth Engine.
3. Image Filtering and Preprocessing: Preprocess the data to filter out cloudy or lowquality images that might affect the accuracy of your methane estimates. This step involves cloud masking and data filtering based on quality control parameters.
4. Time Series Chart: Create a Time Series Chart in Google Earth Engine to visualize the methane concentration over time for the selected study area. You can plot the methane concentration values against the acquisition dates of the satellite images.
5. Methane Estimation: Use statistical methods or machine learning algorithms available in Google Earth Engine to estimate the methane concentration trend, seasonal variations, or anomalies for your study area. This step may involve time series analysis techniques such as smoothing, trend decomposition, or machine learning models.
6. Interpretation and Analysis: Interpret the results from the Time Series Chart and derived methane concentration estimates. Analyse the temporal patterns and potential drivers of methane concentration changes in your study area.
7. Visualization and Reporting: Use visualization tools in Google Earth Engine to create interactive maps, animations, or charts to illustrate your findings. This will help communicate the results effectively to your audience or stakeholders.
#methane #concentration #googleearthengine #airquality #globalwarming #sentinel5p