Excel Chart Tip: Create a graph in PowerPoint using data from Excel

Welcome to another Excel Chart Tips video. These videos are inspired by the work I do with business professionals to visually communicate financial results and analysis as well as the forum posts I answer from users on MrExcel.com.
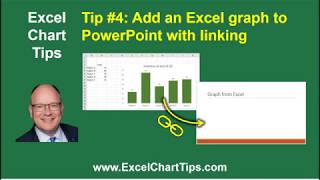
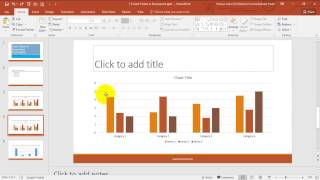
In this video I show how to add a graph to a PowerPoint slide by creating the graph in PowerPoint using data copied from an Excel worksheet. There is no link between the data in the Excel worksheet and the PowerPoint slide. In the video I am using Excel 365 on Windows 10, and most modern versions of Excel will look very similar. If you like the video, please subscribe to the channel and add a comment below.
If you want to learn what you should do to create presentationready Excel charts that are easy to update and reuse, sign up for my free minicourse at https://thinkoutsidetheslide.teachabl....
If you want quickly learn expertlevel Excel techniques to create presentationready charts that are easy to update and reuse without programming, addins, or web tools, check out my Excel Chart Skills 501 course at https://thinkoutsidetheslide.teachabl....
You can access the entire playlist of Excel Chart Tips videos at www.ExcelChartTips.com.