Finding Areas Under And What Is The Standard Normal Distribution Curve And Z Scores Explained

In this video we discuss what is and how to find areas under the standard normal distribution curve and z scores. We cover how to use them to find areas or probabilities for less than a z score, greater than a z score, or between 2 z scores.
Transcript/notes (partial)
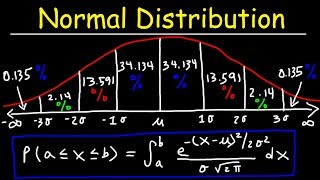
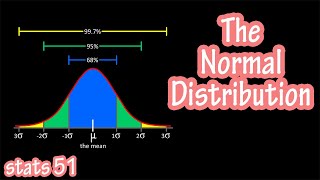
In a previous video we discussed what a normal distribution is, it is a curve above the x axis that is symmetrical about the mean. So, if we draw a line right down the middle, both sides are equal in shape and area under the curve. The biggest thing to understand is that the space under the curve is an area, and this area actually represents the probability, and this area is equal to 1.
The standard normal distribution makes two modifications, and that is that the mean is 0 and the standard deviation is 1. The reason this is important is that it allows us to use z scores, and z scores are measures of position that tell us the number of standard deviations a value is from the mean.
For instance if we had a z score of 2.13, that would be this line here on our standard normal distribution graph. So, it is 2.13 standard deviations from the mean.
The formula for a z score is z equals a value minus the mean divided by the standard deviation.
So, lets say you gathered some data for a year for your commuting time to work. The average time was 44 minutes, with a standard deviation of 3.5 minutes and assume it is normally distributed. Graphing this, we have the mean of 44 here in the middle. If we add 1 standard deviation to the mean, we get 47.5 here, and adding 2 standard deviations we get 51 here. Subtracting 1 standard deviation from the mean, we get 40.5 here, and subtracting 2 standard deviations from the mean, we get 37 here.
Now let’s say we want to know the probability that it takes you less than 40 minutes to get to work tomorrow. 40 on the graph is about here, so it lies between negative 1 and negative 2 standard deviations from the mean. So, if we can calculate the area from less than 40 minutes, to the left of the line, that will be the probability that you get to work in less than 40 minutes.
This is where z scores come in. So, first, we are going to convert the 40, in this case our x value, into a z score. We have z equals 40 minus 44, the mean, divided by 3.5, the standard deviation, which equals negative 1.14. Now we can graph this on the standard normal distribution curve, like this. And with this z score of 1.14, we can use a standard normal distribution z score table to look up the area or probability.
So, we find 1.1 in the left column, and go over 5 columns to the right under .04, which is 1.14, and the value equals 0.1271. This value is the area, to the left of the line, or the probability.
For our question, we would answer, there is a 12.71% probability that it takes less than 40 minutes to get to work tomorrow.
A couple of notes. When we write this probability, we write it as probability of x less than 40. We don’t use less than or equals to. The reason for this is that for a continuous variable, the probability of an exact value is zero, as vertical lines, in theory have no area. So, if we wanted to find the probability of between 45 to 50 minutes, we would write that as probability of 45 less than x, less than 50, or we could have probability of x greater than 48. The second thing is that the values in the standard normal distribution z score table give the area to the left of the z score or z value, even the table for positive z scores gives you the area to the left.
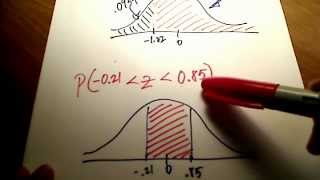
There are 2 other important ways to use this method, for finding the area or probability of something between 2 values, or finding the area or probability of something greater than a value.
What is the probability that it takes you between 38 and 45 minutes to get to work? On the normal distribution graph we are looking for this area here.
So, we have probability of 38 less than x, less than 45. First we need to convert 38 and 45 to z scores. Using our formula, we have 38 minus 44, the mean divided by 3.5, the standard deviation, which equals 1.71. For 1.71 we have 0.0436, and for 0.29 the table shows 0.6141.
Lets look at this on the standard normal graph. So, we have the area to the left of 1.71 equals .0436 and the area to the left of 0.29 is .6141. And we need to find the area between these 2 values. To find this, we subtract the area to the left of 1.71 from the area of 0.29. So, 0.6141 minus 0.0436 equals 0.5705, and that is our probability.
Timestamps
0:00 What Is The Normal Distribution Curve?
0:22 Standard Normal Distribution Curve Explained
0:32 Z Scores And Standard Normal Distribution
0:54 Formula For Z Scores
1:14 Example Problem For Z Score And Standard Normal Distribution
2:35 How To Use A Z Score Table
3:36 2 Important Concepts
4:15 3 Different Ways To Use Z Scores
4:34 How To Find The Probability Between 2 Values
5:59 How To Find The Probability Of Greater Than A Value