Free Sample Lesson: Cross Filtering In Power Bi

Sign up for our Excel webinar, times added weekly: https://www.excelcampus.com/blueprint...
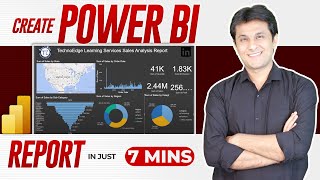
Cross Filtering is an amazing and powerful feature of Power BI. This video is a free sample lesson from The Power BI Dashboards & Data Online Course by Excel Campus.
One of my favorite features of Power BI is cross filtering.
Cross filtering allows you to click on any element of a chart to filter all the other charts on the page or dashboard. So, if you click the November bar in a column chart, all the charts on the page will be filtered for November data.
It even works across different data sets as long as a relationship has been created between them. This basically turns every chart and visualization into a slicer.
Cross filtering allows us to quickly explore our data and find insights. It's pretty amazing stuff, and you just have to see (and try) it to really appreciate it's power.
Interested in learning more about Power BI?
Checkout The Power BI Dashboards & Data Online Course
This is an online course that uses my stepbystep handson learning system. You will follow the video lessons and build an interactive dashboard for a ski resort company.
Learning Power BI will help you stand out from the crowd and become the data superhero of your organization.
The course will equip you with the most important skills to help you get up to speed and start creating your own dashboards. I look forward to having you join us for this fun learning experience.
Please click the link below to learn more and enroll in the course.
https://www.excelcampus.com/powerbic...
00:00 Introduction
00:10 Cross Filtering
04:22 Outro