Secret sauce that brings YouTube followers, views, likes

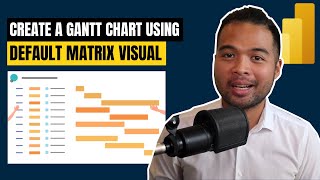
Gantt Chart in Power BI: Complete Guide

This video tutorial explains how to create a Gantt chart in Power BI. It walks you through the data required, including tasks, start dates, and end dates. You can also include additional information such as projects, progress, resources, and milestones. The video also shows how to import a custom Gantt chart visual and configure it to display your data.
#PowerBI #GanttChart #Tutorial #DataViz #ProjectManagement #ProjectTimeline #BusinessIntelligence #Dashboard #HowTo #DataAnalysis


![[IBCS] New Column chart in Power BI Feb 2024 Update](https://i.ytimg.com/vi/4Kn9jmgUlnY/mqdefault.jpg)

Recommended