Generating Standard Curve and Determining Concentration of Unknown Sample in Excel - Easy Method

In this video lecture, we explain about
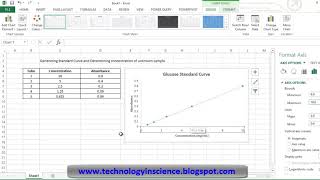
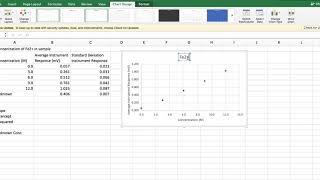
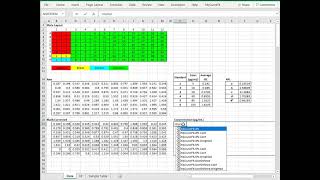
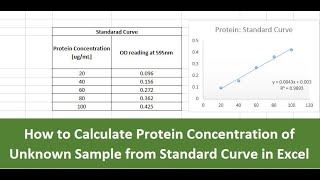
Generating Standard Curve and Determining the concentration of Unknown Samples in Excel.
Processing absorbance data
Plotting concentration vs absorbance scatter plot
Adding Trendline
Displaying R2 value and equation on chart
Calculating the concentration of the unknown sample such as protein concentration from the absorbance
Biology Lectures is a research organization with the mission of providing free, worldclass education for anyone, anywhere. We offer quizzes, questions, instructional videos, and articles on a range of academic subjects, including biology, microbiology, pharmacology, bioinformatics, immunology, biochemistry, anatomy and physiology, and many more.
Please Subscribe to our channel: / biologylectures
Please follow us on
Facebook: / biologylectures
Disclaimer
This video is for educational purposes only. Copyright Disclaimer Under Section 107 of the Copyright Act 1976, allowance is made for "fair use" for purposes such as criticism, comment, news reporting, teaching, scholarship, and research. Fair use is a use permitted by copyright statute that might otherwise be infringing. Nonprofit, educational, or personal use tips the balance in favor of fair use.
#Biologylectures #biochemistry #protein