HISTOGRAM | 7 QC Tools | Quality Control Tools | Lean Six Sigma Tools | Total Quality Management

HISTOGRAM | 7 QC Tools | 7 Quality Tools | Quality Control Tools | Lean Six Sigma Tools | Total Quality Management
Download ⬇ your copy of 7 QC Tools PDF Handbook Now!
https://shakehandwithlife.myinstamojo...
HISTOGRAM
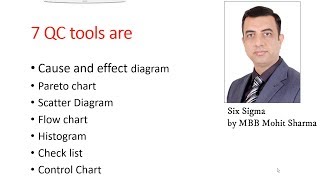
From the group of 7 QC Tools, the HISTOGRAM is the third tool of significant importance.
The Histogram is an SPC technique. It is a graphical tool that represents the data values with the help of vertical rectangular bars.
The Histogram is used to showcase the large amount of data using vertical rectangular bars. It helps in analyzing the properties of data in statistical process control such as the distribution of the data, the spread of the data, variation in the process, and skewness present in the data.
VERTICAL BARS IN HISTOGRAM
1) When vertical bars on both sides of the tallest bar are equal and in descending order, making a normal curve like a bell shape, the data, in this case, has a SYMMETRICAL OR NORMAL distribution.
2) When the vertical bars from the tallest bar descend and make a longer tail on the righthand side, the data, in this case, has RIGHTHANDED SKEWNESS
3) When the vertical bars from the tallest bar descend and make a longer tail on the lefthand side, the data, in this case, has LEFTHANDED SKEWNESS
4) When the height of the Histogram is above normal then the data has a PEAKED distribution.
5) When the height of the Histogram is below normal then the data has a FLATTENED distribution.
6) When there are two vertical bars taller than the rest of the vertical bars then the data has a BIMODAL distribution.
DATA FOR HISTOGRAM
1) Individual Frequency Count: The frequency of every observation counts individually using tally marks.
2) Counting data into GROUPS OR CLASS INTERVALS: When there are a very large number of observations the data values are divided into class intervals of equal width. The width of the class interval is the difference between the upper and lower limits of the class interval.
WHEN TO USE HISTOGRAM
The Histogram is used for the graphical presentation of data, analysis of the data, understanding of the skewness of the data under statistics, business statistics, economics, accounting, lean six sigma, data science, machine learning, quality control, quality excellence, problemsolving, operational excellence, research methodology and various other analytical studies.
CHAPTERS:
0:00 What is a Histogram
0:24 Histogram as a QC Tool
0:44 Data analysis using Histogram
1:35 Data collection for Histogram
2:07 Data presentation using Histogram
#histogram #7qctools #statistics #dataanalytics #quality #qualitycontrol #qualitymanagement #businessstatistics #datascience #leansixsigma
Related Videos and Playlists:
• Pareto Chart • PARETO CHART | 7 QC Tools | Quality C...
• Pareto Chart in Hindi • Pareto Analysis | 7 QC Tools in Hindi...
• Cause and Effect Diagram • CAUSE AND EFFECT DIAGRAM | 7 QC Tools...
• Cause and Effect Diagram in Hindi • Histogram | 7 QC Tools in Hindi | Qua...
• 7 QC Tools English Tutorials: • PROCESS FLOW CHART | 7 QC Tools | Qua...
• 7 QC Tools Hindi Tutorials: • Control Charts | 7 QC Tools Hindi | Q...
• New 7 QC Tools English Lectures: • Affinity Diagram | New 7 QC Tools | Q...
• New 7 QC Tools Hindi Lectures: • Affinity Diagram | New 7 QC Tools in ...
Subscribe for the latest videos @ShakehandwithLife
Website https://shakehandwithlife.in
PDF Notes and eBooks https://shakehandwithlife.myinstamojo...