Get free YouTube views, likes and subscribers

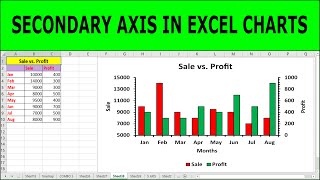
How To Add A Second Y Axis To Graphs In Excel

In this tutorial, I’m going to show you how to add a second Y axis to a graph by using Microsoft Excel. Adding a secondary Y axis is useful when you want to plot multiple data series that are measured on different scales.
HOW I CREATED THIS TUTORIAL (AFFILIATE LINKS)
Screen recorder & editor https://techsmith.z6rjha.net/c/198849...
YouTube SEO https://www.tubebuddy.com/SHTeach
Software (Microsoft Excel 365 ProPlus)
FOLLOW US
Website https://toptipbio.com/
Facebook / toptipbio
Twitter / toptipbio
AFFILIATE DISCLAIMER
Some of the above links are affiliate links, meaning I will earn a commission if a sale is made after clicking on the link.


Recommended