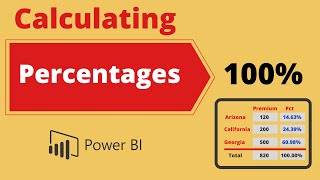
How to build a bar chart showing both values and percentage of total in Power BI

Learn how to bar chart showing both values and percentage of total in Power BI. Power BI does not have a builtin visual that allows you to create something like that. We will create a Bar Chart showing both Values and Percentage of total in Power BI in three simple steps.
⏰TIME STAMP⏰
0:00 Intro
0:30 DAX to calculate percent of total in power bi
1:22 Step 1: Create Line and Stacked Column Chart
1:52 Step 2: Modify and Format Chart
2:56 Step 3: Insert Slicer
3:19 Wrap Up
Watch related Power BI playlists
• Power BI Visualization and Service
Let’s connect on social
LinkedIn: / techtarsolutions
Facebook: / techtar.solutions
Subscribe to my YouTube channel
https://www.youtube.com/c/TechTARSolu...
For more advanced training, check out our training programs https://techtarsolutions.com/training...
www.techtarsolutions.com
#TechTARSolutions