how to calculate NDVI using LANDSAT 8 in google earth engine

In this tutorial, I will present how to calculate NDVI using Landsat 8 images in Google Earth Engine
Google Earth Engine (EE) is a cloud/browserbased platform for planetary scale geospatial analysis that relies on Google's processing and storage capabilities to enable large analyses in very little time. Earth Engine is home to hundreds of public remote sensing/geospatial datasets totaling more than thirty petabytes, and is continuously updated as images are captured. Here, we take advantage of the uptodate and easytoaccess satellite imagery in Earth Engine to calculate and display a vegetation index (NDVI) from recent Sentinel imagery, anywhere on earth.
Besides tabular and timeseries data, Data Scientists or Data Analysts can also draw information and insight from image data and demonstrate satellite image analysis using Google Earth Engine, or referred to as Earth Engine. Satellite images are raster data just like any image. What makes them different is that satellite images have spatial attributes. Each pixel represents a location in the real world. Analyzing satellite images means we are going to get information on what is in our study area. The science focusing on studying this field is Remote Sensing.
Earth Engine is a platform to perform Remote Sensing, like satellite image analysis. It has many satellite images in its archive. I am not going to explain much about Earth Engine and Remote Sensing here because I have done it in another article here. If you are not familiar with Remote Sensing or Earth Engine, please find yourself a simple explanation in that article. That article actually performed how to apply Machine Learning for land cover detection on Landsat 8 images.
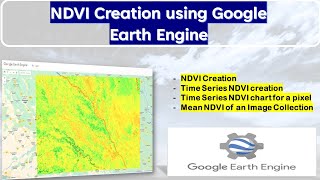
Normalized Difference Vegetation Index (NDVI) using Landsat 8 images too. NDVI is an index commonly used in satellite image analysis to get basic information on vegetation distribution.
Landsat 8 images, just like other images, consist of pixels. Each pixel contains values. While the colorful image has 3 bands, usually red, green, and blue, Landsat 8 has 11 bands. Two of these bands used to generate NDVI are band 5 (NIR) and band 4 (Red). Figure 1 is the spectral curves showing spectral response to 3 objects. The green curve represents the spectral response to vegetation. We can see that vegetation reflects NIR the most and absorbs the red spectrum the most. Other objects have different characteristics. The water barely reflects the red spectrum and reflects all NIR. Soil reflects less NIR but reflects more red spectrum than vegetation does.