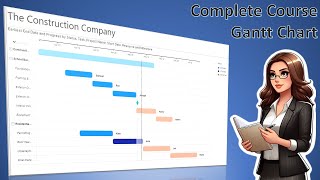
How to create a Gantt chart in Power BI (with a free visual!)

Gantt charts are typically used to track project progress, but they can be useful for any data that has a start and end date. In this video, we go over how to configure one in Power BI using Microsoft's free custom visual from AppSource, adding bookmark filters to make it more userfriendly.
Looking for something more elaborate with milestones and dependencies? Try this video:
• How to use David Bacci's Deneb templa...
Need to get Planner data? Here's how:
• Get PLANNER Data into Power BI with a...
Or, how to get Planner data for ALL your groups and plans:
• Get Planner Data for ALL your Plans i...
0:00 Intro
0:20 Installing the visual
0:58 Power Query get relative days from today
4:19 Configuring the visual
10:20 Creating bookmarked views