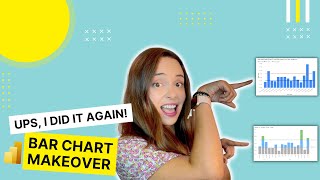
How to create a lollypop chart in Power BI

In this video, I will show you how to create a lollypop chart in Power BI using just standard visuals and error bars.
What do you think of this lollypop chart? Yay or nay?
Let me know in the comments!!
Link to learn more about the new On Object Interaction feature in Power BI:
https://learn.microsoft.com/enus/pow...
Want to help me produce more quality content? Join my Patreon!
/ datapears
Join me at the Power BI Report Design Bootcamp and become a POWER BI DATA STORYTELLING MASTER!
https://powerbiacademy.datapears.com/...
Books I recommend (Power BI)
Storytelling with Data https://amzn.to/3WzHezG
How Charts Lie https://amzn.to/3kDd3dV
Knowledge Is Beautiful https://amzn.to/3ZXZK7S
Microsoft Power BI Cookbook https://amzn.to/3WAZKb9
The Definitive Guide to DAX https://amzn.to/3H3XrYf
Don't Make Me Think (UX) https://amzn.to/3H0AdSZ
Books I recommend (Business)
Expert Secrets https://amzn.to/3iU718g
Dotcom Secrets https://amzn.to/3Xx2YOf
Think and Grow Rich https://amzn.to/3iYvuck
Rich Dad Poor Dad https://amzn.to/3H7kQrK
The 4Hour Workweek https://amzn.to/3ZY2KBf
Atomic Habits https://amzn.to/3Wy2dDg
Check my Blog
https://www.datapears.com/blog
Follow me on Twitter
/ datapears
Follow me on LinkedIn
/ marapereira
My gear:
Mic: https://amzn.to/3Bi0oT4
Ring light: https://amzn.to/3UfNso5
Camo Studio: https://reincubate.com/camo/
OBS Studio: https://obsproject.com/
Wondershare Filmora: https://shrsl.com/3twbr
Thumbnails (Canva) : https://partner.canva.com/jWqERZ
contact: [email protected]
#PowerBI #powerbidesktop #powerbitraining #powerbideveloper #data