How to create an interactive 3D Pie Chart in Excel 2016

FREE Download this Microsoft Excel Workbook from below link. Please SUBSCRIBE, Like, Comment and Share this video to your friends and family.
Please Click this link to SUBSCRIBE: https://www.youtube.com/faysaleasyexc...
The data used about Covid19 is a sample data generated from Excel function RANDBETWEEN. So there is no source of this sample data.
Free Download Link:
Download Link 1: https://docs.google.com/spreadsheets/...
About this video:
Create this Excel Pie Chart and level up your Excel skill on how to make a pie chart in excel or how to create an interactive 3D Pie Chart in Excel 2016 for sales analysis. This video will help you to introduction on how to make a pie chart in Excel, represent your sales or business data to your Boss or Clients. Please SUBSCRIBE our YouTube Channel. Hope you will like this chart.
✅ Join us:
YouTube: https://www.youtube.com/faysaleasyexc...
Blog: https://afaysal.blogspot.com
Watch our other videos:
1. Emojis in Excel: • How to insert Emojis in Excel formula...
2. Excel Match function: • Excel Match function and how to use M...
3. Excel MID function: • Excel MID Function | Extract the Time...
4. Add Zero before Numbers in Excel: • How to add Zero before numbers in Exc...
5. Hide and Unhide Columns: • How to hide and unhide columns in Exc...
6. Make a DropDown list: • How to make a drop down menu in Excel...
7. My Fiverr Excel Test: • My Fiverr Microsoft Excel 2016 Skill ...
8. Daily Sales Trend Chart: • Daily Sales Trend Report in Excel 2016
9. Present vs Previous Sales: • Present vs Previous Month Daily Sales...
10. Mobile Phone Sales Dashboard: • Mobile Phone Sales Dashboard in Excel...
11. Smart Watch Sales Dashboard: • Smart Watch Sales Dashboard in Excel ...
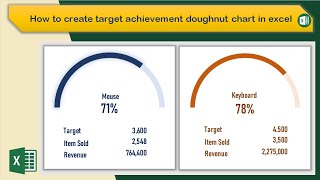
12. Gauge Chart: • Dashboard Gadget Gauge Chart in Excel...
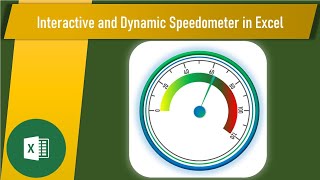
13. Speedometer Chart: • Dashboard Gadget Speedometer Chart in...
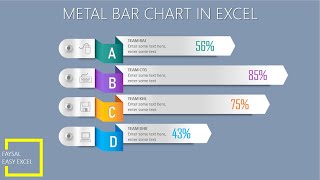
14. Metal Bar Chart: • Infographic Metal Bar Chart in Excel ...
15. 2D Pencil Chart: • New Infographic 2D Pencil Chart in Ex...
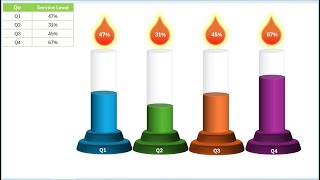
16. Test Tube Chart: • Infographic 3D Test Tube Chart in Exc...
17. Pillar Chart: • Learn Infographic 3D Pillar Chart in ...
18. Pencil Bar Chart: • Infographic Pencil Bar Chart in Excel...
19. Column Chart with background: • 2D Column Chart with Background Image...
20. Cylinder Chart: • 3D Cylinder Progress Column Chart in ...
#piechart #excelpiechart #piechartexcel #exceltips #exceltricks #msexcel #faysaleasyexcel #excelformula #excel2016 #learnexcel #excelforbeginners #microsoftexcel

![Recreate 3D Effect From Squarespace “Hello Down There” Template [SQUARESPACE SUPER BOWL AD]](https://i.ytimg.com/vi/VD9rsMXIcng/mqdefault.jpg)