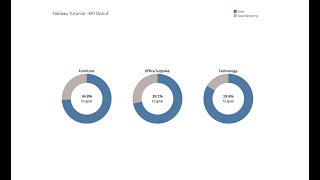
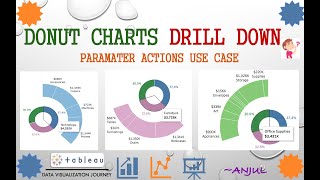
How To Create Donut Chart in Tableau

This tutorial will guide how to create donut chart in Tableau.
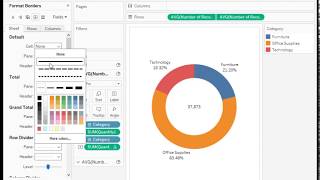
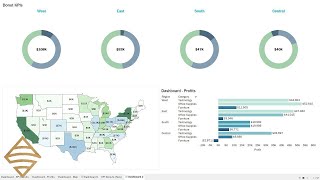
Donut chart is a good way to show percentage of different categories out of total 100% by dividing the circle into proportional segments.
======DOWNLOAD TABLEAU WORKBOOK========
https://public.tableau.com/app/profil...
=========================================
===How To Visualize Single Measure Using Donut Chart===
• How To Visualize Single Measure Using...
=========================================
======= WATCH MORE VIDEOS =======
TABLEAU HELPFUL TIPS
• Tableau Helpful Tips
TABLEAU FOR BEGINNERS
• Tableau For Beginners
MICROSOFT POWER BI FOR BEGINNERS
• Microsoft Power BI For Beginners
TEXT DATA PREPROCESSING IN PYTHON
• Text Data Preprocessing In Python
PYTHON FOR DATA SCIENCE
• Python For Data Science
=========================================
Please like, share and subscribe to the channel. Thank you to every single person who has already subscribed to the channel.
Keep supporting the channel.
#tableau #tableaututorial #businessintelligence #visualization #donut #donutchart


![How to Create an Drill Down Donut Chart [in Tableau]](https://i.ytimg.com/vi/1Pb44LbR_a0/mqdefault.jpg)