How to create mineral composite ratio map bands In ArcGIS

Utilization of Landsat OLI and ETM+ data for mineraloccurrences mapping
On May, 2013 Landsat 8 Operational Land Imager (OLI) became available as well as Thermal Infrared Sensor (TIRS) imagery. This data consists of nine spectral bands with a spatial resolution of 30 meters for Bands 1 to 7 and 9, and 15 meters resolution for Band 8 (panchromatic). New band 1 (ultrablue) is useful for coastal and aerosol studies and new band 9 is useful for cirrus cloud detection. Bands 24 are visible bands whereas band 5 corresponds to near infrared (NIR). In addition, Band 6 and 7 correspond to shortwave infrared (SWIR) spectrum. Thermal bands 10 and 11 are useful in providing more accurate surface temperatures and are collected at 100 meters resolution. Approximate capture scene size is 170 km (northsouth) by 183 km (eastwest).
Band Ratio:
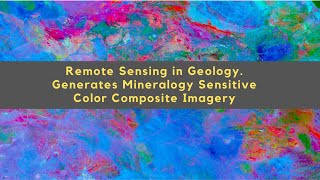
Band Ratio images improve the contrast between the features by divide the brightness values at peaks and troughs in a reflectance curve, after removing the atmospheric conditions from the image. Spectral band rationing enhances compositional information while suppressing other types of information about earth’s surface. This method is very useful for highlighting certain features or materials that cannot be seen in the raw bands. Band ratio transformation is useful for qualitative detection of hydrothermal alteration minerals (Di Tommaso. 2007; Rockwell et al. 2008; Pour and Hashim. 2011). The ratio 4/2 is useful for mapping iron oxides because it has absorption in the blue region, where it has a high reflectance in the red region. The ratio 6/7 was used in this study for its ability to map kaolinite, montmorillonite and clay minerals. All these features have a high reflectance on band 6 and low reflectance in band 7 of Landsat 8 image. The ratio 6/5 was used for mapping ferrous minerals due to the high reflectance of these minerals in this ratio (Gupta., 2003). Tow combinations of RGB images have been used for lithological mapping and hydrothermal alteration zones which they called Sabin’s ratio (4/2, 6/7 and band 10 as RGB and 4/2, 6/5 and 6/7 as RGB)
The Advanced Spectral Analysis (ASA) technique, one of the most advanced remotesensing tools, has been used as a possible means of identifying mineral occurrences