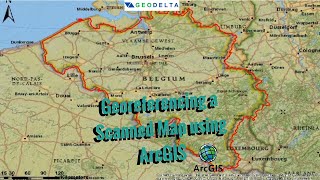
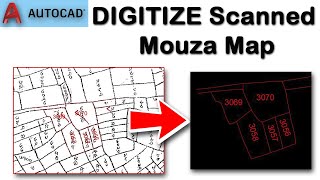
How to digitize a map in ArcGIS

#GIS
#Digitizing
#GeologicalMaps
#Georeferencing
video with audio discretion: (recommended)
Almost in F Tranquillity by Kevin MacLeod is licensed under a Creative Commons Attribution 4.0 licence. https://creativecommons.org/licenses/...
Source: http://incompetech.com/music/royalty...
Artist: http://incompetech.com/
• How to digitize a map in ArcGIS Map...
Introduction.
There is a great deal of geographic data available in formats that can not be
immediately integrated with other GIS data. In order to use these types of data in
GIS it is necessary to align it with existing geographically referenced data, this
process is also called georeferencing. Georeferencing is also a necessary step in
the digitizing process. Digitizing in GIS is the process of “tracing”, in a
geographically correct way, information from images/maps. The process of
georeferencing relies on the coordination of points on the scanned image (data to
be georeferenced) with points on a geographically referenced data (data to which
the image will be georeferenced). By “linking” points on the image with those
same locations in the geographically referenced data you will create a polynomial
transformation that converts the location of the entire image to the correct
geographic location. We can call the linked points on each data layer control
points.
The selection of control points is important. Some guidelines:
• They should be easy to confirm as representing the same geographic
location (street intersection, political boundary, landmark, etc.).
• They should be spread across the image to be registered, one suggestion is
to select a control point near each of the corners of the image and few
throughout the interior will often work well.
• Good overlap between the two dataset is also important.
• Make sure you are clicking as close as possible to the same geographic
location, zooming in can help in this process.
As you add points the complexity of the transformation that is possible increases.
This is not always a good thing, 1st, 2nd, and 3rd order polynomials can be
calculated, usually a 1st or 2nd order transformation is all that is necessary. In
order to complete a 1st order transformation you need a minimum of three
control points, for a 2nd order you need a minimum of six control points, and for a
3rd order you will need a minimum of ten points. A 1st order transformation will
shift, scale, and rotate your image while 2nd and 3rd order transformations will
bend and curve straight lines, which might be necessary, but is rare.
Creating a New Layer by Clipping
Open Both layers (NYStreet and ManhattanCensus).
Open ArcToolBox (red toolbox on menu) and open Analysis Tools, then
Extract. Choose the clip tool.
The input feature is the street map.
The clip feature is the census tracts of Manhattan.
The output class should go somewhere you can find it and be named
something you will recognize (ManhattanStreet.shp as an example).
Don’t worry about cluster tolerances.
Click Ok.
Add the new layer and remove the original street layer.
Georeferencing/Registering an Image
Tools:
The primary tool we will be using is the georeferencing toolbar
The georeferencing toolbar is probably not visible when you first open ArcGIS, you can
open it be clicking on view, selecting toolbars, then activating the georeferencing toolbar
option.
Add the manhattan.sid file.
Right click the shapefile (not image) and “Zoom to Layer,” this is a nice feature
you might have used before that let us get to the geographic extent of a specific data layer
quickly.
From the georeferencing toolbar, click the “Layer” dropdown arrow and
select the manhattan.sid image name.
Click “Georeference” and select “Fit to Display” from the dropdown.
This will display the image in the same general space as the manhattan census tracts
layer.
Before adding control points you should move the image around a bit to get it closer to
the orientation and position of the GIS layers you are using.
Use the Rotate and Shift tools for this.
Now you are read to add control points. Click on the control points tool.
You should be using the clipped data for linking, and use the labels too.
(Right click the layer and select label features).
To add a link, click the mouse on the image first, then on a known location
on the GIS database. You can use the magnify tools to get a close look at subsets of
the data.
You can also turn on the effect toolbar to change the transparency to see both layers at
once if you like, or you can turn the layers off and one as you select points from each.
Once you’ve added a few links you can open the link table to see how each has worked.
View Link Table is the final icon on the right of the georeferencing toolbar.