How to EASILY create gauge charts with target lines using standard visuals in Power BI

Sometimes you need to see how a metric is performing against a target but over a period of time, or categories, in a chart.
This is easy to achieve in Power BI using error labels to create target lines in a standard column or bar chart, and you can find out how in this video.
#PowerBI #DAX #PBICoreVisuals
Dataset for Sales Data and file for original dim date table M code
https://data.world/deanchereden/super...
https://data.world/deanchereden/super...
c h a p t e r s
00:00 Intro
00:49 Load in data
01:50 Create a gauge column chart
01:56 Create measure for y axis
02:11 Set month name for x axis
02:48 Create a target measure
03:41 Create target lines
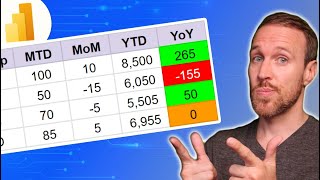
07:12 Add green or red conditional formatting
09:10 Add variance data label with arrows
13:03 Create a dynamic title measure
14:46 Add conditional formatting to title
15:44 Add conditional formatting to border
16:43 Change to a bar chart
My email [email protected]
My website https://www.deanchereden.com
Twitter / deanchereden
Vhsceral Gimetime https://chll.to/dd82e17f
Listen to Chillhop Music • Misha & Jussi Halme Bliss (A Felici...