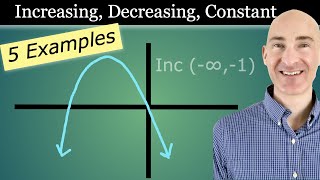
How to Find Increasing and Decreasing Intervals on a Graph (Finding a Maxima u0026 Minima)

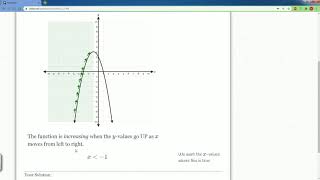
For the following exercises, use the graph of each function to estimate the intervals on which the function is increasing or decreasing.
Here are all of our Math Playlists:
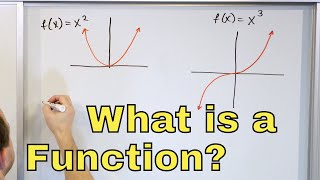
Functions:
Functions and Function Notation:
• Functions and Function Notation
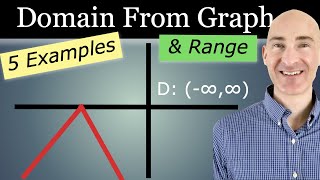
Domain and Range:
• Domain and Range
Rates of Change and Behavior of Graphs:
• Rates of Change and Behaviors of Graphs
Composition of Functions:
• Composition of Functions
Transformation of Functions:
• Transformation of Functions
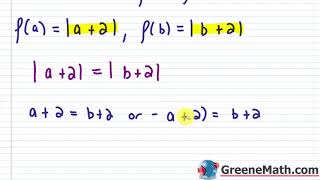
Absolute Value Functions:
• Absolute Value Functions
Linear Functions:
Linear Functions:
• Linear Functions
Graphs of Linear Functions:
• Graphs of Linear Functions
________________________________________________________________
This question(s) was provided by OpenStax™ (www.openstax.org) which is licensed under the Creative Commons Attribution 4.0 International License. (https://creativecommons.org/licenses/...)
OpenStax™ is a registered trademark, which was not involved in the production of, and does not endorse, this product.
You can find the problem(s) in the following OpenStax™ textbooks:
Algebra & Trigonometry: https://d3bxy9euw4e147.cloudfront.net...
College Algebra: https://d3bxy9euw4e147.cloudfront.net...
College Algebra with Corequisite Support: https://d3bxy9euw4e147.cloudfront.net...
Precalculus: https://d3bxy9euw4e147.cloudfront.net...
SUBSCRIBE if you want your questions answered!
/ @glasertutoring
Want us as your private tutor? Get started with your FREE initial assessment!
https://glasertutoring.com/contact/
#RatesOfChange #RatesMath #Math