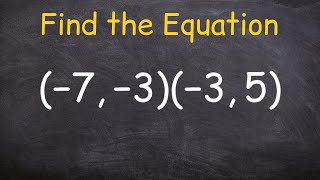
How to Find Slope Using Two Points | 8.EE.B.6 💗

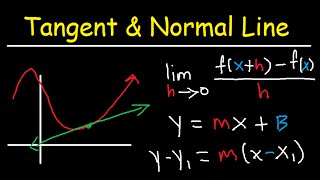
In this video lesson we will first discus slope as a ratio. We will discover that the ratio of the rise over the run is slope. We will discover the rise is the change in y or vertical distance between two points. We will learn that the run is the change in x or the horizontal distance between two points. We will learn the slope formula and that the variable m represents the slope of a line. We will then learn how to describe the slope of a line using terms positive, negative, zero and undefined. We will use the formula to find the slope of a line given two points on the line. Student practice is embedded in the lesson with modeled exemplar solutions.
The Magic of Math Website: www.themagicofmath1.com
Purchase Editable Guided Notes Template: https://www.teacherspayteachers.com/P...
Purchase an Editable Copy of the Animated Google Slides Used to Create this Video https://www.teacherspayteachers.com/P...
#slope
#slopeformula
#findslope
#describeslope
#slopefromtwopoints
00:00 Introduction
00:12 What is Slope?
01:55 How to Describe Slope
02:32 Unique Slopes
04:05 Using the Slope Formula
05:58 Student Practice #1
07:01 Student Practice #2
07:53 Student Practice #3
08:45 Student Practice #4
https://www.teacherspayteachers.com/S...
Common Core Math Standards
8.EE.B.6 Use similar triangles to explain why the slope m is the same between any two distinct points on a nonvertical line in the coordinate plane; derive the equation y = mx for a line through the origin and the equation y = mx + b for a line intercepting the vertical axis at b.
Use functions to model relationships between quantities.
8.F.B.4 Construct a function to model a linear relationship between two quantities. Determine the rate of change and initial value of the function from a description of a relationship or from two (x, y) values, including reading these from a table or from a graph. Interpret the rate of change and initial value of a linear function in terms of the situation it models, and in terms of its graph or a table of values.