How to Graph the Equation y = x + 8

In this video we'll draw the graph for y = x + 8. You may also see this written as f(x) = x + 8.
First, we will use a table of values to plot points on the graph. Once we have two or three points, we can draw our line for the linear equation. You can choose any values of x for your table, however, 0, 1, and 1 are often best since they result in point that will fit on your graph paper.
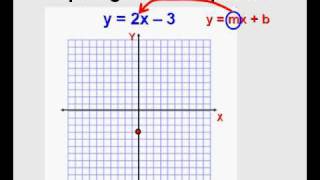
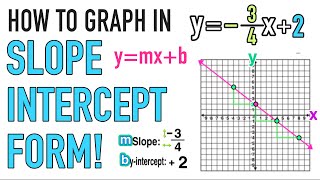
We can also use the slope intercept form to draw the graph. Here we use the general format y=mx + b (sometimes written y=mx + c).
b tells us where the graph crosses the y axis. That gives us our first point for the graph.
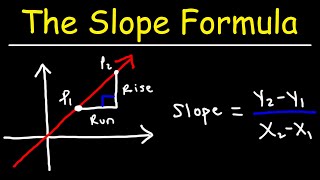
m is the slope. We can use the slope to find the rise over run. For whole numbers, like 1, we consider that to be 1/1. So we go up 1 on the y axis and over 1 on the x axis. We can do that as many times as we need to in order to draw an accurate line.
I prefer to use the slope intercept formula since it is much quicker with some practice. Then I’ll plug some values into y = x + 8 to make sure they fall on the line. If they don’t there is likely a problem.
When graphing equations it is helpful to have them in slope intercept form (y = mx + b), just like we have in this video.