How to make an Interactive u0026 Beautiful Excel Dashboard in 5 Steps

Dashboards are a highly sought after skill in business analytics. In this comprehensive and detailed video, learn how to create a beautiful & functional business KPI (metric) dashboard using Microsoft Excel in less than 30 minutes.
Prior skills needed:
Basic familiarity with Excel (watch this tutorial: • How to use Microsoft Excel Beginner... )
How to create a pivot table (watch this tutorial: • How to use Pivot Tables in Excel A ... )
How to create slicers (watch this tutorial: • How to use Excel Slicers like a PRO: ... )
Sample Files:
Please download the blank data & outline file here:
https://chandoo.org/wp/howtocreate...
Download completed workbook:
The full dashboard is now part of my Excel School Dashboards program. If you join the course, you will unlock this + 50 more Excel workbooks and 32+hours of videos on all things Excel.
Visit https://chandoo.org/wp/excelschoolp... to sign up.
More Videos on Dashboards:
Project Dashboard with Excel • Make an awesome Project Management Da...
Website Metrics Dashboard with Excel • Make an Excel Dashboard in just 15 mi...
Beautiful Sales Dashboard with Excel • How to create a fully *INTERACTIVE* a...
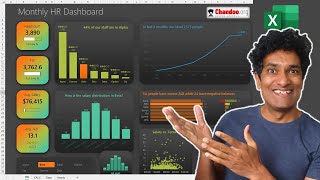
HR Dashboard with Excel • Make an Amazing HR Dashboard in Excel...
Dashboards Playlist • How to Make Excel Dashboards
~
Video Timestamps:
================
0:00 Introduction to the Dynamic Business Dashboard
1:07 The Blank Data File & our data
1:52 How to design the dashboard?
3:50 Setting up the Pivot Tables & DAX
7:35 Preparing the Dashboard
10:40 Adding the Bar chart with Top 5 Products
15:01 Adding the trends
19:22 Sales Person Table Report
23:48 Adding conditional formats
25:00 Tidying up the formatting
26:46 More things you can add
~
#excel #dashboard