How to use Standard Deviation and other Statistics on the Casio fx-9750GIII Graphing Calculator

Don't have this calculator? Pick one up here: https://amzn.to/48FMUih
using my Amazon affiliate link
*Disclaimer: Clicking this link and making a purchase means that I am awarded a small commission at no added cost to you.
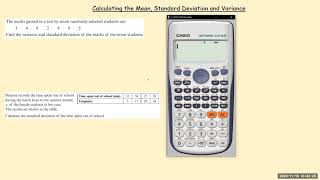
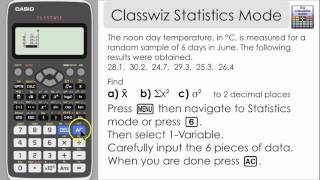
A quick tutorial on how to use and find statistics on the Casio fx9750 G III Graphing calculator. This video covers using Stats mode and lists when entering data sets and frequency lists, calculating the mean, sample standard deviation, population standard deviation, variances, sum and more of a data set. It also covers switching back to Normal (Calculate) mode.
Contents:
0:00 Intro
0:22 Buttons & data set used
0:44 Statistics mode
1:08 Clearing previous data
1:36 Entering your data set
2:11 Calculating your basic stats
3:46 Using Frequency to enter repeating data
6:17 How to Recall Stats data
7:11 How to find Population and Sample Variance
6:56 Return to Normal (COMP) Mode
7:58 Outro