How to visualize water quality data in QGIS 3? From points to raster to contour lines - Tutorial

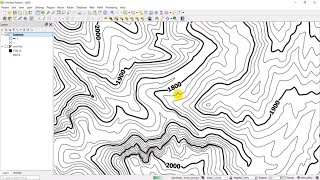
Spatial interpolation techniques used to evaluate estimations of physical and chemical constituents in areas where they are not estimated (Murphy et al., 2009). This tutorial will show how to interpolate data from point data to obtain a raster that covers the study area and, then, to obtain contour lines from the raster.
The Inverse Distance Weighted (IDW) method is one of the most used due to its simplicity. IDW expect that each point has a nearby impact that reduces with distance. It gives more weight to the points nearest to the forecast area. QGIS has the ability to perform this interpolation method by using data points and the result is displayed as a raster file.
Input data
You can download the input data for this tutorial here:
https://www.hatarilabs.com/ihen/how...