Image Analysis/NDVI Classification
Image Analysis
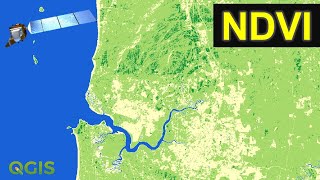
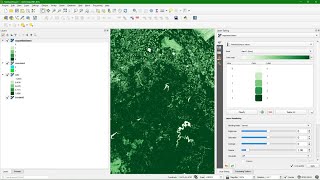
NDVI Classification
What is NDVI (normalized Difference Vegetation Index)
Normalized difference vegetation index (NDVI) quantifies vegetation, by measuring the difference between near –infrared (which vegetation
strongly reflected) and red light (which vegetation absorbs).
NDVI always range from 1 to +1. For example, when you have negative values. it’s highly likely that it’s water. On the other hand, if you have an NDVI values close to +1, there is a high possibility that is dense green leaves. But when NDVI is close to zero, there aren’t green leaves and it could even be an urbanize area.
Values close to zero (0.1 to 0.1) generally corresponded to barren areas of rock, sand, snow. Low, positive values represent shrub and grass land (approximately 0.2 0.4), while high values indicate temperate and tropical rain forests (values approaching 1).
Class NDVI Range
Water 0.28 to 0.015
Builtup area 0.015 to 0.14
Barren land 0.14 to 0.18
Shrubs and grass land 0.18 to 0.27
Sparse vegetation 0.27 to 0.36
Dense vegetation 0.36 to 0.74
How do calculate NDVI
As shown below normalized difference vegetation index ( NDVI) Uses the near infrared( NIR) and RED channels in its formula.
¬¬¬¬¬¬¬¬¬¬¬¬¬¬¬¬¬¬¬ NDVI= (NIR –RED)/(NIR+RED)
Healthy vegetation (chlorophyll) reflect more near infrared ( NIR) and green light compared to other wavelengths. But it absorbs more red and blue light.
For sentinel 2: NDVI=(B8B4)/(B8+B4)
Land sat 8 NDVI: NDVI=(B5B4)/(B5+B4)
Landsat 5 and 8: NDVI =(B4B3)/(B4+B3)
Modis NDVI: NDVI =(B2B1)/(B2+B3)
ENVISAT MERIS: NDVI=(B13B07)/B13+B07)