Interactive Excel Dashboard for Call Center KPIs: Easy Tutorial | How to Create an Excel Dashboard

Learn how to Create a Dynamic and Interactive Microsoft Excel Dashboard.
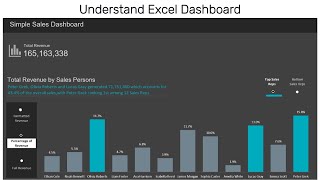
In this tutorial, I’ll show you how to create an interactive Excel dashboard to track and analyze key call center KPIs, such as total calls, calls reached, deals closed, and deal values.
Download the dataset here: https://drive.google.com/file/d/18Ws...
Watch the Power BI version of this Dashboard here: • Power BI Dashboard Tutorial: Analyze ...
✔ If you need me to create your Dashboard send WhatsApp Message to: +234 810 6090 365 Business only.
Learn stepbystep how to visualize your data with charts and tables, and create a dynamic dashboard that allows you to filter by month, year, or specific metrics. Perfect for call center managers, data analysts, or Excel enthusiasts looking to improve their data visualization skills.
By the end of this tutorial, you’ll be able to build a professional call center performance dashboard using Excel.


![Business Analyst Full Course [2024] | Business Analyst Tutorial For Beginners | Edureka](https://i.ytimg.com/vi/1QKIvt05LmA/mqdefault.jpg)


![HandsOn Power BI Tutorial Beginner to Pro [Full Course] ⚡](https://i.ytimg.com/vi/5X5LWcLtkzg/mqdefault.jpg)