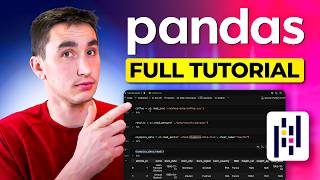
Intro to Data Visualization in Python with Matplotlib! (line graph bar chart title labels size)

Practice your Python Pandas data science skills with problems on StrataScratch! https://stratascratch.com/?via=keith
Join the Python Army to get access to perks!
YouTube / @keithgalli
Patreon / keithgalli
Yay finally posting again. Hopefully this video will help you get comfortable working through the matplotlib library. I'm going to post a follow up video with realworld examples (combining pandas with matplotlib) and different types of plots next week. I originally was going to include that in this one, but I thought the video was getting a bit too long.
In this video we walk through some of the basics of matplotlib. We start by making a simple line graph. We learn how to give the graph a title and label the x & y axis. We learn how to scale the graph by specifying the x & y tickmarks. After this, we restyle our line by passing in keyword arguments then do basically the same thing with a shorthand notation. We resize our graph and save it. Then we end with a simple bar chart.
Source Code (includes code and data for next video as well):
https://github.com/KeithGalli/matplot...
Matplotlib Pyplot Documentation:
https://matplotlib.org/api/_as_gen/ma...
Font List:
http://jonathansoma.com/lede/datastu...
Install libraries Needed for this video:
Option 1:
Open up a terminal window and type
pip install matplotlib
pip install numpy
pip install pandas
Option 2:
Download anaconda which will contain all the packages we need. A video on how to do this is here: • Python Tutorial: Anaconda Installat...
Thanks for watching! Make sure to like and subscribe to not miss any future videos! Let me know if you have any questions.
Follow me on social media!
Instagram | / keithgalli
Twitter | / keithgalli
Video Timeline:
0:00 Video overview (note realworld examples moved to next video)
1:43 Setup
2:23 Our first line graph!
4:50 Add title and labels for x & y axis
7:13 Change font type, size, etc.
9:02 Change tick marks (scale graph)
11:20 Add a legend
12:25 Restyle our line (color, line style, markers, width)
15:53 Shorthand notation to restyle lines
17:27 List of line customization options
17:55 Plot more complex lines
22:20 Resize Graph
24:48 Save Graph
26:00 Annotating/Cleaning Code
27:00 Bar Chart
31:25 Final Comments
If you are curious to learn how I make my tutorials, check out this video: • How to Make a High Quality Tutorial V...
*I use affiliate links on the products that I recommend. I may earn a purchase commission or a referral bonus from the usage of these links.